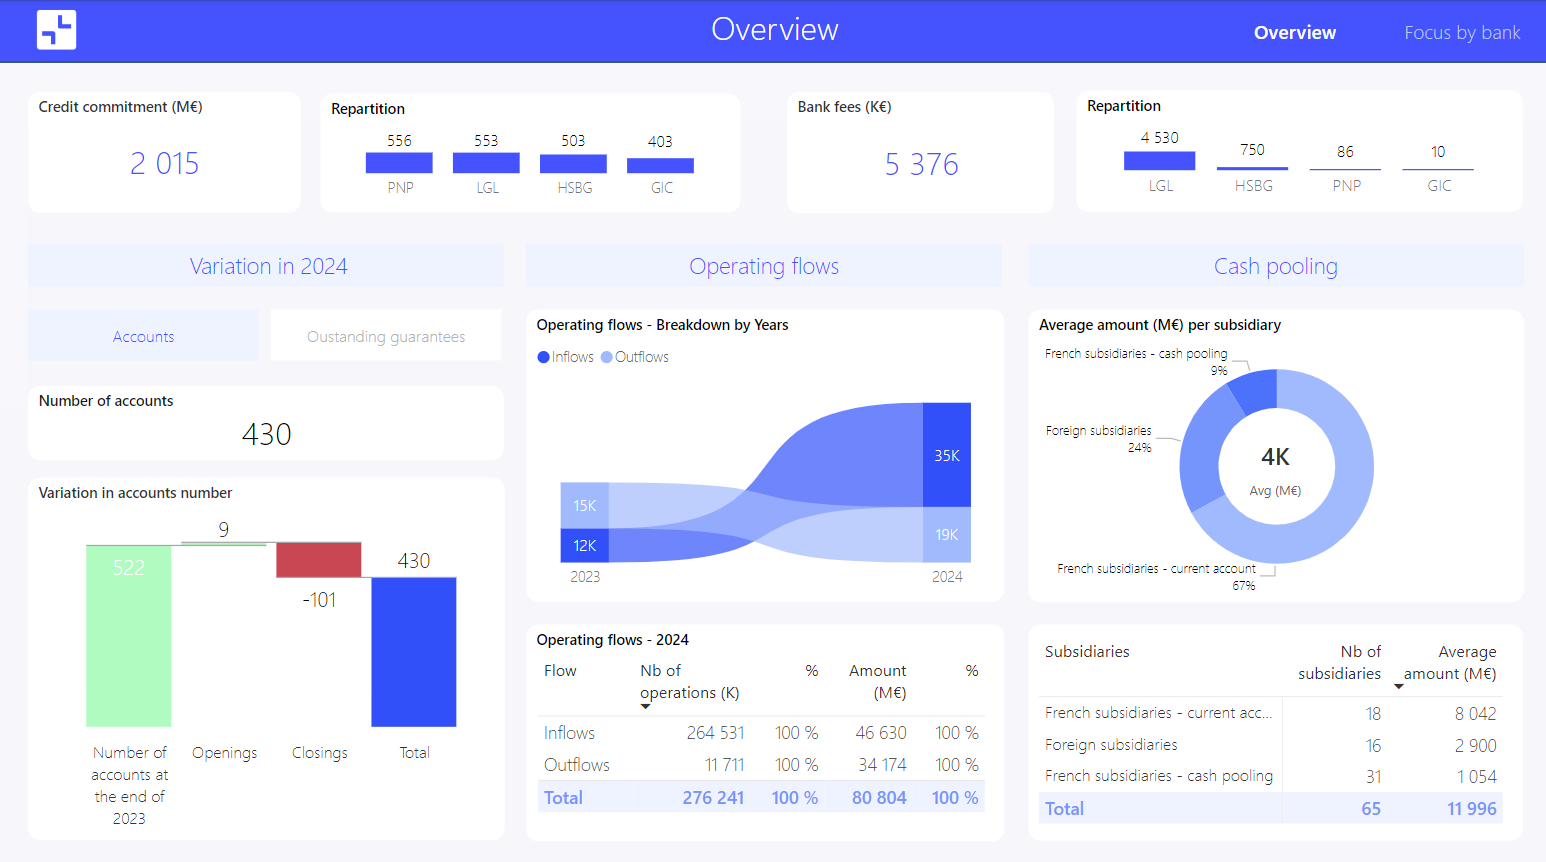
Power BI Report
Power BI is a data visualization technology developed by Microsoft and integrated into the Power Platform.
Power BI allows you to:
- connect to a variety of data sources (Excel file, SharePoint folder, database, etc.)
- transform data in the Power Query engine integrated into Power BI (similar to the one available in Excel)
- visualize final data in report pages
- share this report on any device (PC, tablet, mobile) and grant differentiated access to data (via row-level security)
Power BI is a robust solution that is continuously improved to incorporate user feedback. New features are presented monthly and updates are carried out regularly.
At F31, we are convinced that Power BI is the most suitable solution to ensure that available business data supports informed decision-making.
Indeed:
- creating a clean data model beforehand ensures the integrity and quality of the data used in the report
- report data is regularly updated: all analyses display the latest available data
- an interactive report not only allows users to view all levels of data granularity: they can also manipulate it and create their own analytical journey via filters and cross-visual interactions
- more broadly, an interactive report serves as a catalyst for promoting a data culture within companies
Interactive financial management reports on Power BI
Optimize your financial management with clear and centralized analysis of your data.
Detailed P&L, in-depth sales analysis, precise budget tracking… Connected to your ERP or other accounting data sources, your dashboard offers a real-time view of your financial performance.
Interactive reports for treasury departments
For treasury departments, interactive reports enable regular tracking of cash, net debt, and disbursements.
Reports can also include bank sheets showing the elements of various banking relationships.
Interactive real estate reports
In the real estate sector, reports allow visualization of portfolio composition and analysis of asset profitability using key indicators (IRR, cash-on-cash, occupancy rate, etc.).
Thanks to the interactivity of visuals and the power of filters, Power BI interactive reports allow access to the finest levels of detail available in your dataset.
FAQ
- What technologies are part of Microsoft’s Power Platform?
The Power Platform also includes Power Apps, Power Automate, Power Pages, and Power Virtual Agents.
- How do you create an interactive report in Power BI?
Five steps are needed to create an interactive report in Power BI from a blank Power BI Desktop file:
– connect to data sources, using the “Get Data” button
– [optional step] transform the data in Power Query Editor (remove columns, filter rows, change types, pivot or unpivot columns, etc.)
– build the data model: a data model consists of various data tables – dimension and fact tables – and the relationships between them
– create measures: calculation instructions written in DAX language (e.g., = SUM(Table[ValueColumn]) )
– add visuals to report pages and specify which fields to use (analysis axes and values)
– publish the report on the Power BI Service and share it with desired collaborators
- How do you share an interactive Power BI report?
An unpublished Power BI report can be shared as a .pbix file. In this form, users can access the dataset, transformations, and remove visuals. However, it’s not the ideal format for sharing an interactive Power BI report.
A published Power BI report can be shared from the Power BI Service by a user with a Power BI Pro license. The report is only accessible to users with at least a Pro license.
The only exception to this rule concerns Power BI Premium capacities. If a report is published in a workspace hosted on a Premium capacity, it is available to all users regardless of their license type.
For more information on Power BI licenses and associated features, check the Microsoft documentation.
- How do you view an interactive Power BI report?
You can view an interactive report on Power BI Service after it has been published:
– if you have a Pro license and the report is published in a workspace you have access to
– if you have a Pro license and have been given a report access link
– if the report is published in a Premium capacity
For more information on Power BI licenses and associated features, check the Microsoft documentation.
An interactive Power BI report can also be viewed in .pbix format. However, this format is more suited to report development than viewing as it doesn’t offer the best user experience (e.g., navigation requires Ctrl + click instead of a simple click in the published report).
- What are the differences between an interactive report and a dashboard?
An interactive report is a set of analysis pages connected to a single dataset.
A dashboard is a collection of visuals or pages from different published interactive reports. A dashboard lets you view analyses connected to different datasets. It provides a summary view of multiple reports and organizes navigation between them: clicking a tile opens the source report.
- How do you create a dashboard from a Power BI report?
To create a dashboard from a Power BI interactive report:
– select the visual or report page you want to include
– click 📌 (top right of the visual or via the “…” in the top gray bar for a page)
– choose an existing dashboard or create a new one


