Business intelligence
End-to-end Business Intelligence solutions, from raw data to decision-making.
As a Microsoft Power BI Partner, we support finance teams and IT departments in delivering full-scale BI solutions, from data ingestion and transformation to interactive reporting and business insights.
We cover the entire Business Intelligence value chain:
-
Data ingestion and processing: leveraging our expertise in Microsoft Fabric, Azure, and the Power Platform, we build robust data warehouses, connect to multiple data sources (ERP, CRM, TMS, flat files, APIs…), and automate data pipelines.
-
Data modeling and structuring: we design tailored data models aligned with your performance monitoring goals, with deep proficiency in M and DAX languages.
-
Reporting and insight delivery: we create custom reports that combine performance, usability, and design, addressing key business areas such as cash flow, sales tracking, financial performance, and asset management.
Our value proposition lies in a unique combination of expertise:
-
Financial acumen, enabling us to grasp the business logic behind your needs and build relevant KPIs;
-
Technical know-how, to implement scalable and reliable solutions using Power BI, Power Query, Power Apps, and Power Automate;
-
UX & design sensitivity, ensuring your dashboards are intuitive, user-friendly, and widely adopted.
Once the reports are published, we implement fine-grained access control (row-level security, user roles), and facilitate distribution, including the ability to export reports into PowerPoint presentations that remain refreshable via the UpSlide add-in.
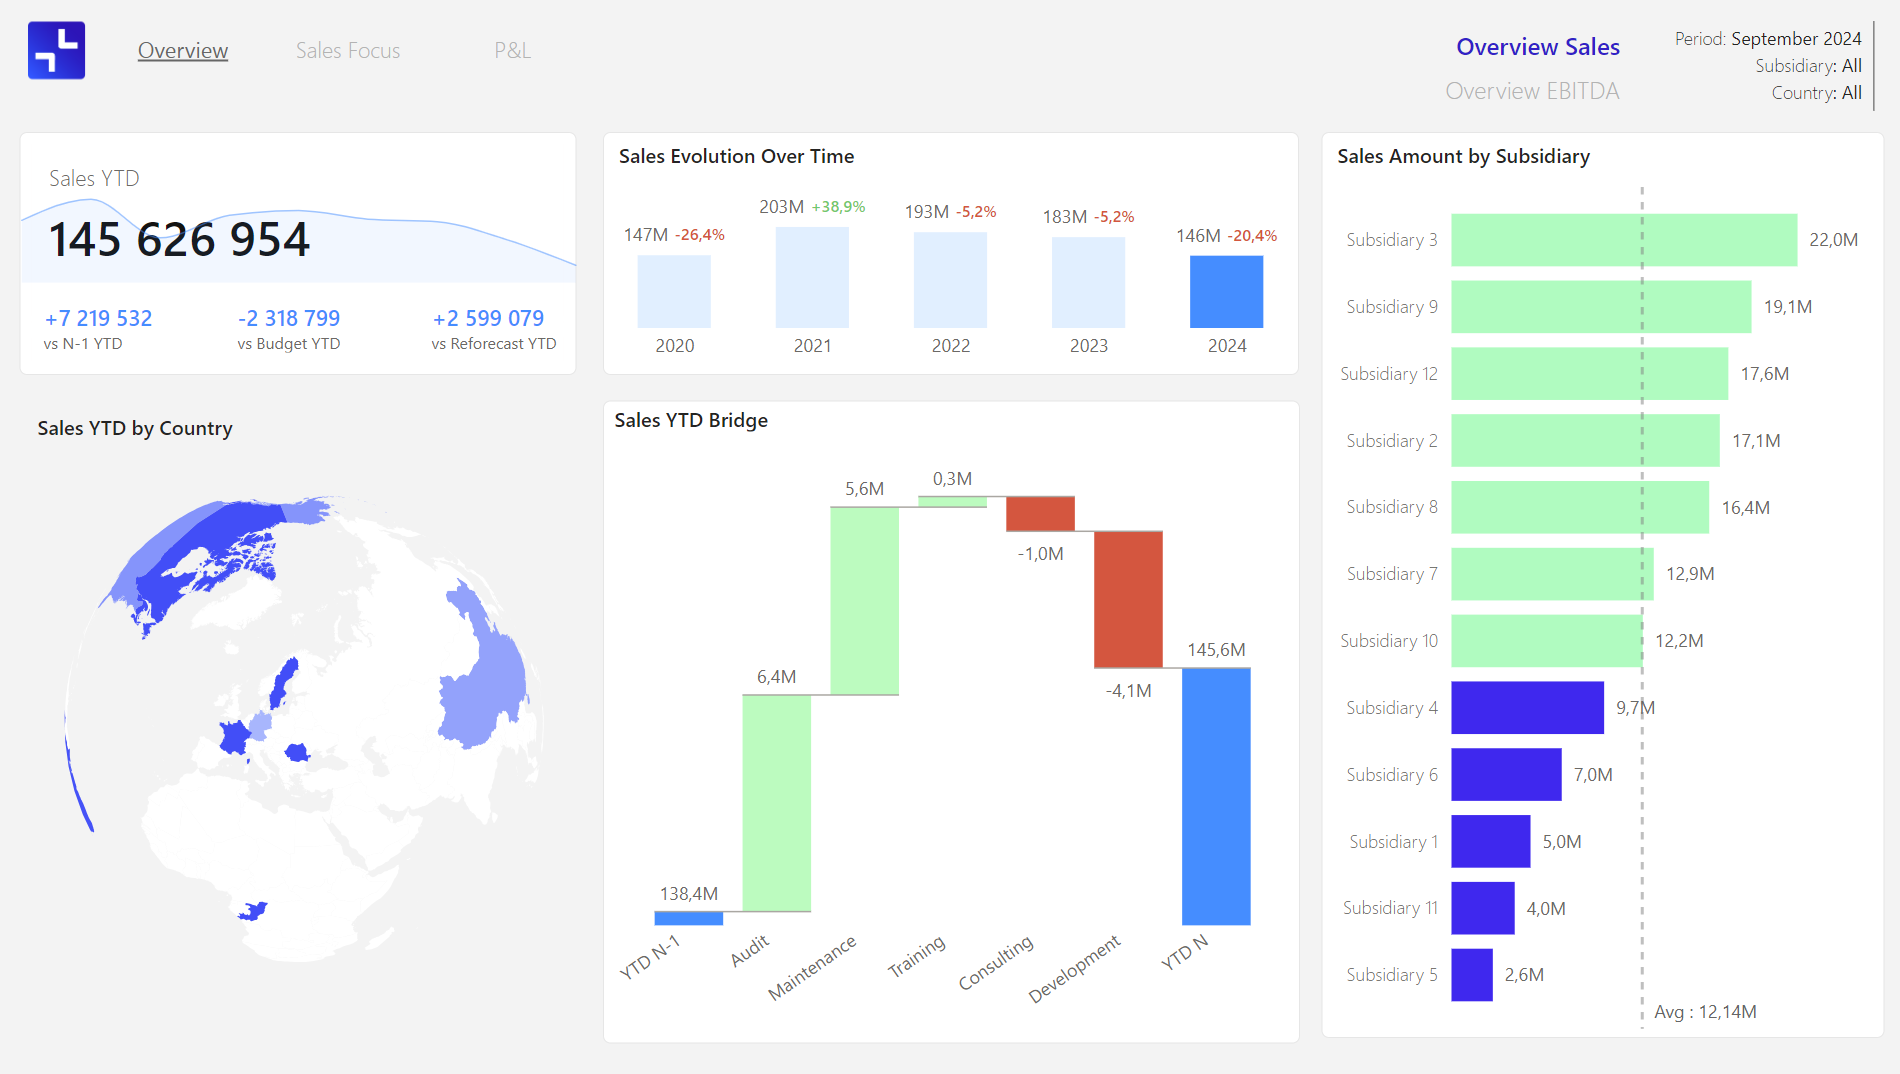
Interactive financial reports in Power BI
Optimize your financial management with a clear and centralized analysis of your data.
With detailed P&L, in-depth sales analysis, and accurate budget tracking, your dashboard, connected to your ERP or other accounting data sources, provides you with a real-time view of your financial performance.
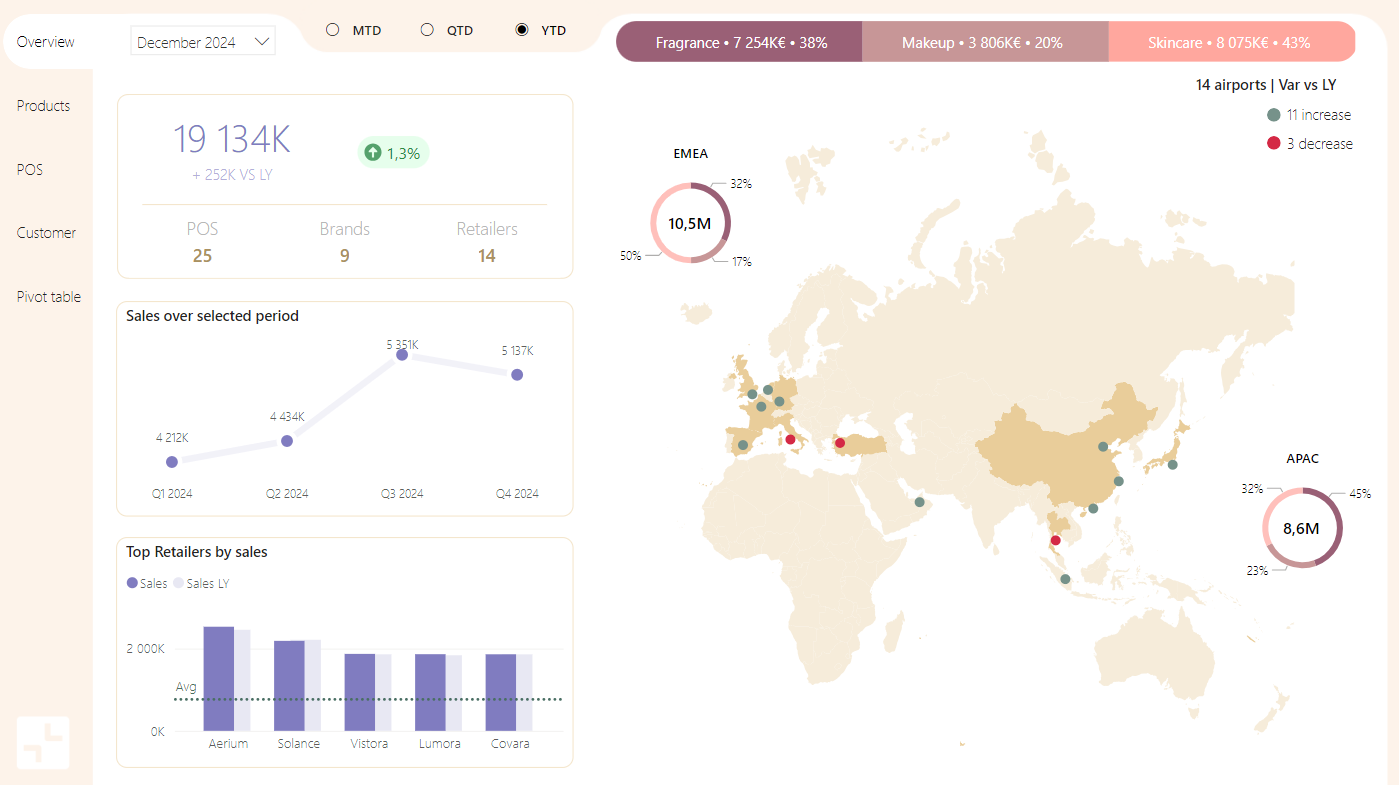
Interactive reports for the travel retail industry
Simple, centralised analysis from heterogeneous data.
Our tailor-made solutions will consolidate your distributors’ sales reports, automatically feed your product/POS tables and offer you dynamic analysis by brand, product line, airport, etc.
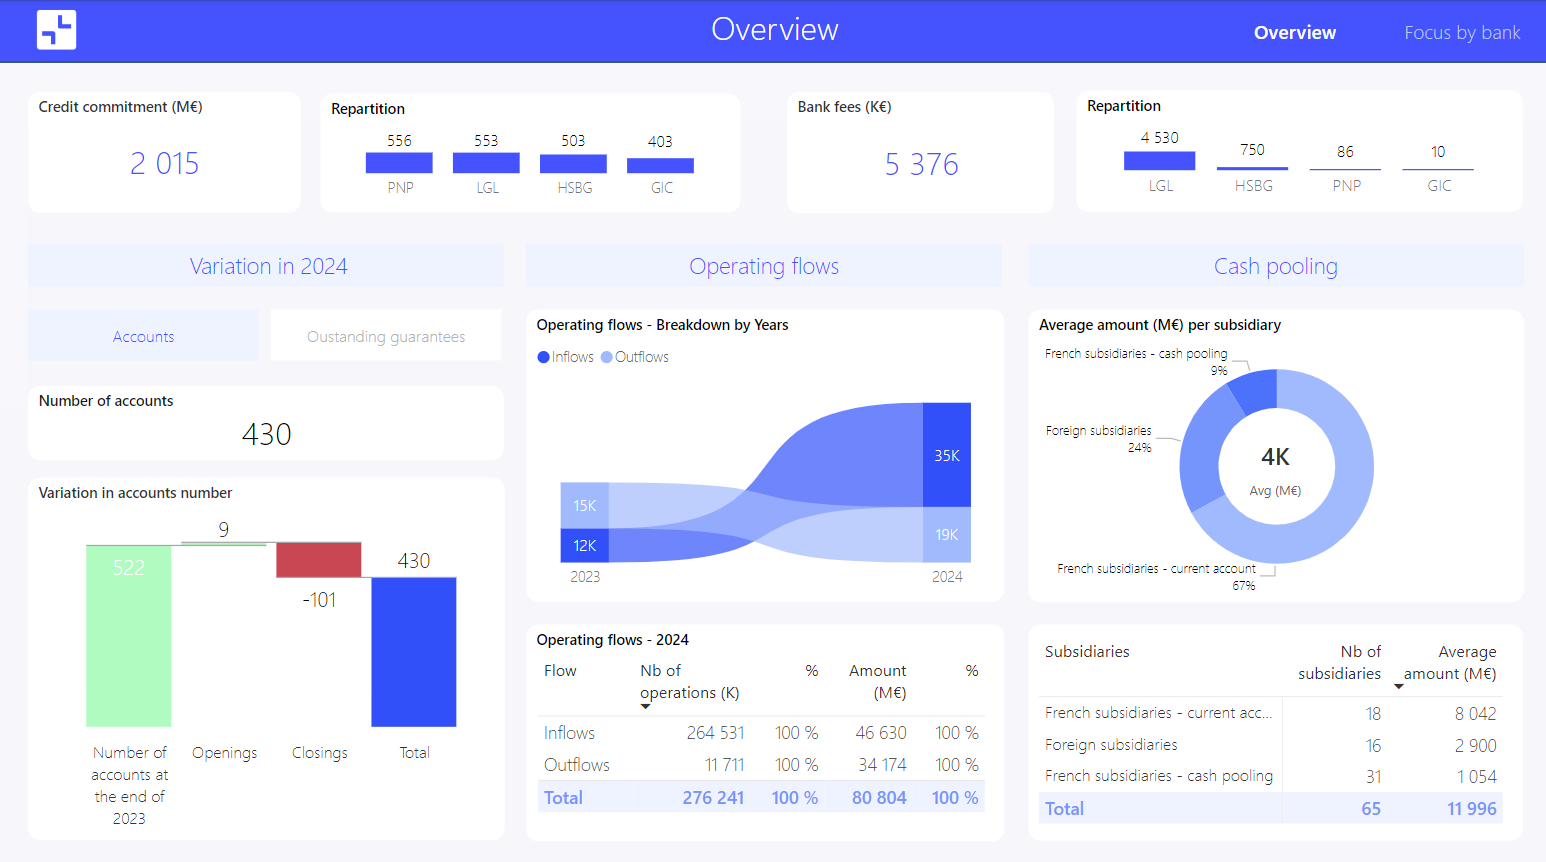
Interactive reports for treasury departments
Easily visualise and analyse your key business figures, wherever you are.
Cash and net debt monitoring, details of payments, banking relationship summary sheets… Your data is up to date and clearly presented in a single dashboard.
Interactive real estate reports
Easily analyse the structure and profitability of your real estate portfolio.
Rental status, IRR, cash on cash, occupancy and reversion rates… Your data is up to date and clearly presented. And you can make the right decisions.
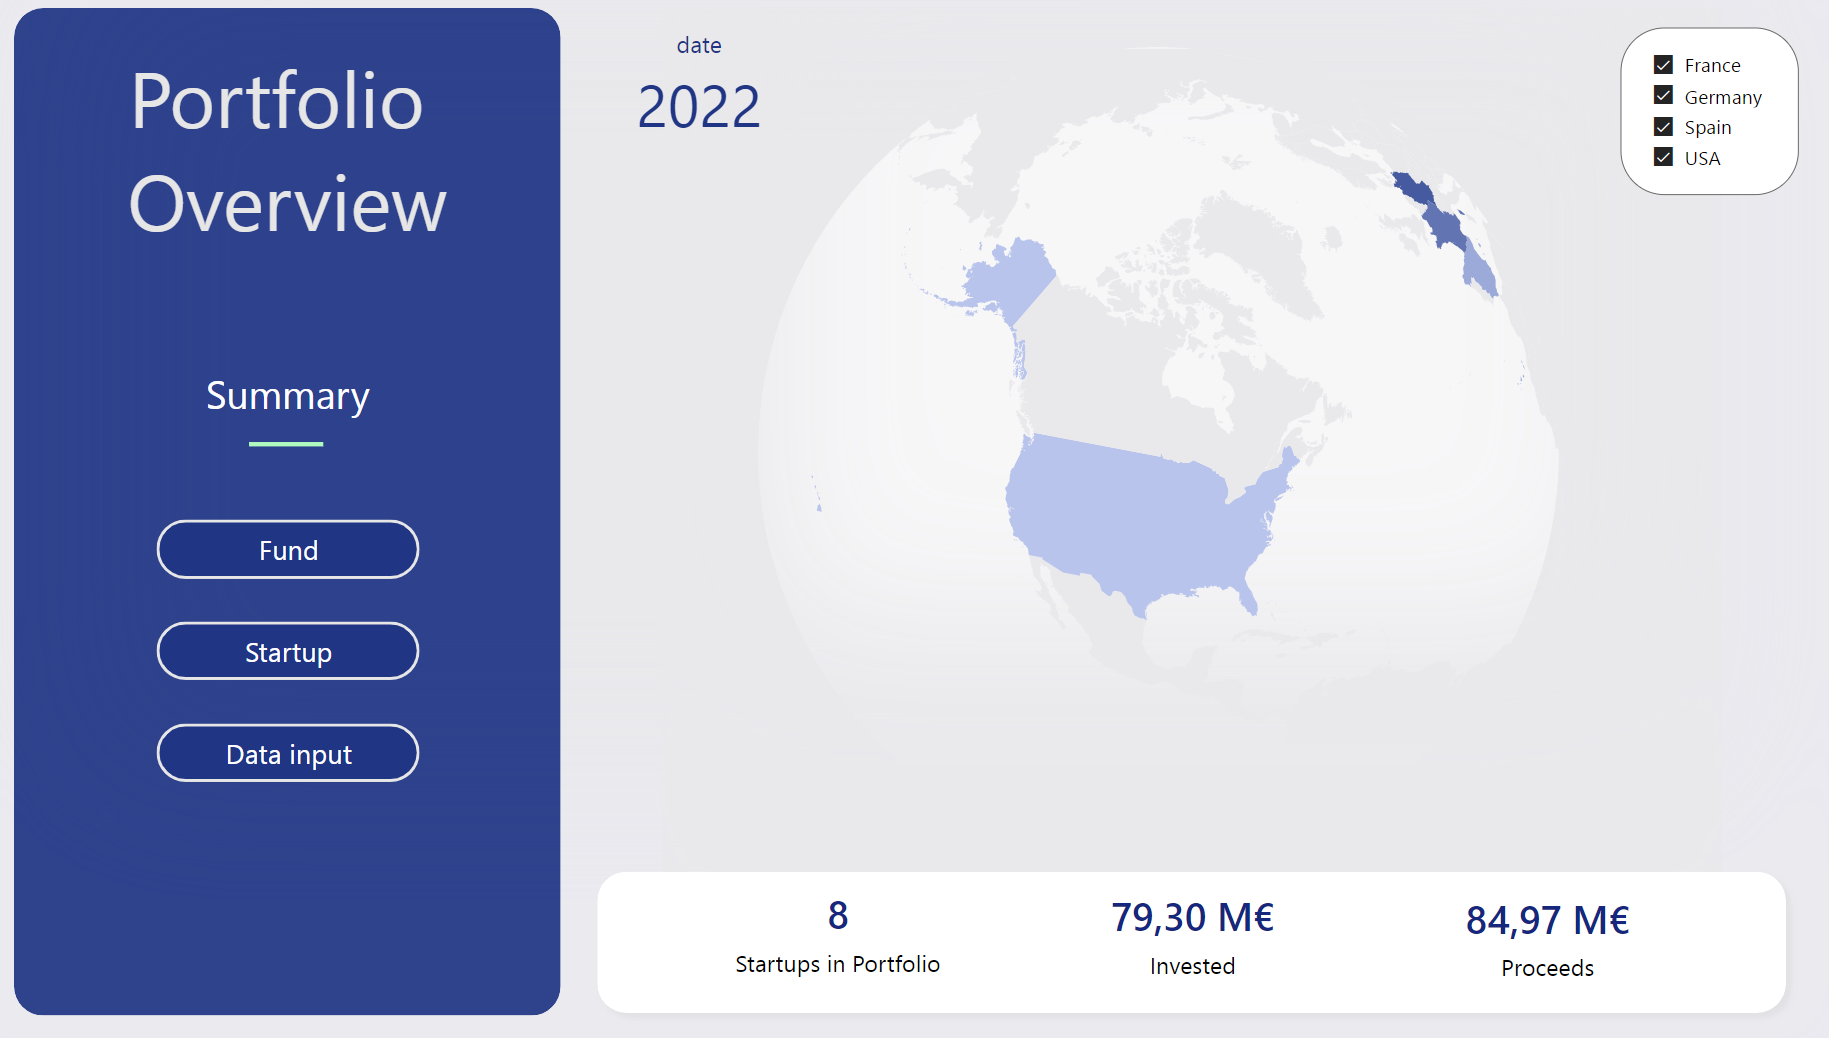
Interactive reports for investment funds
Visualise and analyse the return of your investment portfolio.
Cash-flow evolution, IRR, valuation multiples and debt ratios…
Your data is up-to-date, presented in a clear and an impactful way.

