Cash-on-Cash: How Calculate It?
Asset managers use a number of different indicators to assess the profitability of a real estate project. You’ve probably already heard of IRR, NPV or payback: these indicators are widely used as investment criteria, even outside the real estate sector. Cash-on-cash is another indicator in the same family, which is increasingly gaining its place as a must-have in financial analysis.
Different Profitability Indicators in Real Estate
Before putting the spotlight on cash-on-cash, let’s take a look at the most common profitability indicators.
IRR
- How to calculate IRR?
One of the best-known profitability indicators is the internal rate of return (IRR). It represents the rate of repayment of the sums invested in an asset (the purchase price and the CAPEX) via the cash flows received in the form of rents net of charges and the resale price.
To determine the IRR of a real estate project, simply calculate the cash flows for each year the asset is held. The first year’s cash flow will be negative because the purchase price will be much higher than any annual income generated. Each subsequent year will help to repay the initial investment, until it is finally repaid through the resale of the asset. The IRR is the rate at which the sum of annual cash flows discounted to their present value will equal zero.
An IRR can be calculated before or after financing (levereged vs. unlevereged), which means taking into account, or not, the flows related to financing the acquisition or reconstruction of an asset.
- How should IRR be interpreted?
The higher the IRR, the more profitable the investment is, but also the riskier: the risk associated with investing in this asset will be rewarded by a more attractive return than that of an asset with a lower IRR. In real estate, if an asset represents a high IRR, it probably means that the investment project is designed to create value (‘value add’ strategy). For example, a project of this type could involve the following phases: acquisition of an unattractive asset, demolition, reconstruction or restructuring, change of use and conversion to an asset with a different use.
NPV
- How is NPV calculated?
NPV, or net present value, is the sum of the net cash flows associated with a property project, discounted to their current value. When the NPV is positive, the project is creating value. Like IRR, NPV can be used to compare two assets: the higher the NPV, the more attractive the corresponding investment.
- How should NPV be interpreted?
Unlike the IRR, the amount of the NPV gives no immediate indication on how quickly the initial investment will be repaid, neigther on the level of associated risk. Nevertheless, the return expected by the investor, and the level of risk he accepts, are reflected by the discount rate selected to calculate the NPV. To compare two property projects, it is possible to increase the discount rate of a riskier project: the NPV figure obtained will then indicate whether this project can create more value than its alternative despite the additional risk involved.
So NPV alone is not a sufficient criterion for an enlightened decision-making: it is often used in combination with IRR. On the other hand, using NPV to evaluate the price of a property asset is essential. As part of the capitalisation and DCF methods, property valuation experts use this concept to discount the future cash flows received by the owner of a property during the holding period.
As a reminder, there is a link between IRR and NPV: the internal rate of return corresponds to the discount rate that cancels out the net present value of the project.
This article explains how to calculate IRR and NPV using the various formulas available in Excel.
Payback
- How to calculate payback?
Payback is the indicator that represents the number of periods required to recover the initial investment in an asset. It is generally expressed as a number of years. Its precision depends on the needs and requirements of the person carrying out the analysis: it is possible to calculate it to the nearest day, but it is common to provide the calculation at the monthly level (e.g. 9.5 years = 9 years and 6 months).
Excel does not have a dedicated formula for calculating payback. Nevertheless, the calculation is simple and transparent. To begin with, all you need to do is model the annual cash flow associated with the investment project. Secondly, you need to calculate a cumulative cash flow line: CF year 2 = CF year 1 + CF year 2; CF year 3 = CF year 1 + CF year 2 + CF year 3, and so on.
The cash flows for the first few years will be negative because the initial investment (acquisition price) is generally much higher than the annual income received by the new owner. The next step is to identify the year in which the cumulative cash flow becomes positive: the first year with a positive cumulative cash flow is called the payback year. To improve accuracy, it is possible to calculate the exact moment when the value of the accumulated CF becomes positive: simply compare the last negative flow with the amount of annual income. This division will indicate the payback point in the year. For example, if the ratio is 0.25, this means that you need to wait a further 3 months to recover your initial investment.
- How should payback be interpreted?
At F31, we still see this indicator in our clients’ models, but it has become less common in investment valuation. Like NPV, it does not express the risk associated with an investment. Nor does it express the level of profitability of an asset. On the other hand, it does show very clearly the speed of repayment: in number of periods. One of the main advantages of this indicator is that it is easy to interpret.
Calculating payback can be useful for projects with a long holding period: when the asset is not expected to be resold soon, even though a considerable investment has been made to make it more attractive for rental, for example. In this case, the payback can tell us about the year from which the investment will be reimbursed through new rental income.
What Is Cash-on-Cash?
In the real estate market, cash-on-cash is one of the most popular indicators. Nowadays, it is inconceivable to present an asset management model without calculating this ratio. However, a number of questions arise when calculating it:
- What exactly does it represent?
- Should financing flows be taken into account in the calculation?
- Why is it calculated on an annual basis?
- Can it be negative?
To answer these questions, let’s take a closer look.
How Calculate Cash-on-Cash?
Unlike IRR and NPV, cash-on-cash has no dedicated Excel formula. As with payback, the calculation is simple: it is the annual cash flow received from an asset, divided by the total investment in that asset.
Despite a simple definition on paper, it is not always easy to determine which cash flow components should be included in the numerator and denominator.
- Numerator
In the numerator, the sum of cash flows relating to the operating cycle and those relating to investments over the life of an asset should be considered. Operating cash flows include rents, charges and management costs, as well as costs relating to the transition period: the cost of vacancy, marketing costs and TI’s (tenant improvements), for example.
Investment flows include the costs of acquisition and works, as well as flows received following the resale of the asset at the end of the holding period.
This indicator can be calculated before and after financing. Therefore, to calculate cash-on-cash after financing, it is also necessary to consider the flows linked to the drawing down of the debt, its repayment and the payment of interest.
- Denominator
For the denominator, simply calculate the total amount of cash invested since the start of the project. When the project is partly financed by debt, the equity contribution to the project will be less significant: this will be reflected by a higher cash-on-cash after financing.
How Should Cash-on-Cash Be Interpreted?
Cash-on-cash represents the rate of return on investor flows. In general, it is calculated on an annual basis to give greater visibility of the project’s profile. It shows when repayment of the sums initially invested is accelerating and – conversely – when new drawings may be required to support additional CAPEX, for example.
Cash-on-cash can give an idea of potential cash distributions over the period an asset is held. For example, if an asset is sold off unit by unit, the cash received from the resale of a few units may be distributed to shareholders. High positive cash-on-cash reflects these moments in the life of a property.
Cash-on-cash can be negative: this generally occurs at the beginning of the holding period. This means that the net cash flow generated by the asset remains negative and requires financing.
There are several versions of cash-on-cash: before and after financing.
Conclusion
IRR, NPV, payback and cash-on-cash are the profitability indicators used in the real estate sector. These indicators are often used as criteria for comparing real estate assets in order to make an investment choice or strategic asset management decision. It is important to understand what lies behind a particular indicator and how to calculate it correctly. Each figure after the decimal point can be decisive, given the sensitivity of these indicators to key parameters (such as CAPEX, market rental value, acquisition value or exit yield).
Cash-on-cash is one of the most widely used profitability indicators in asset management at the moment, and is much on demand among investors.
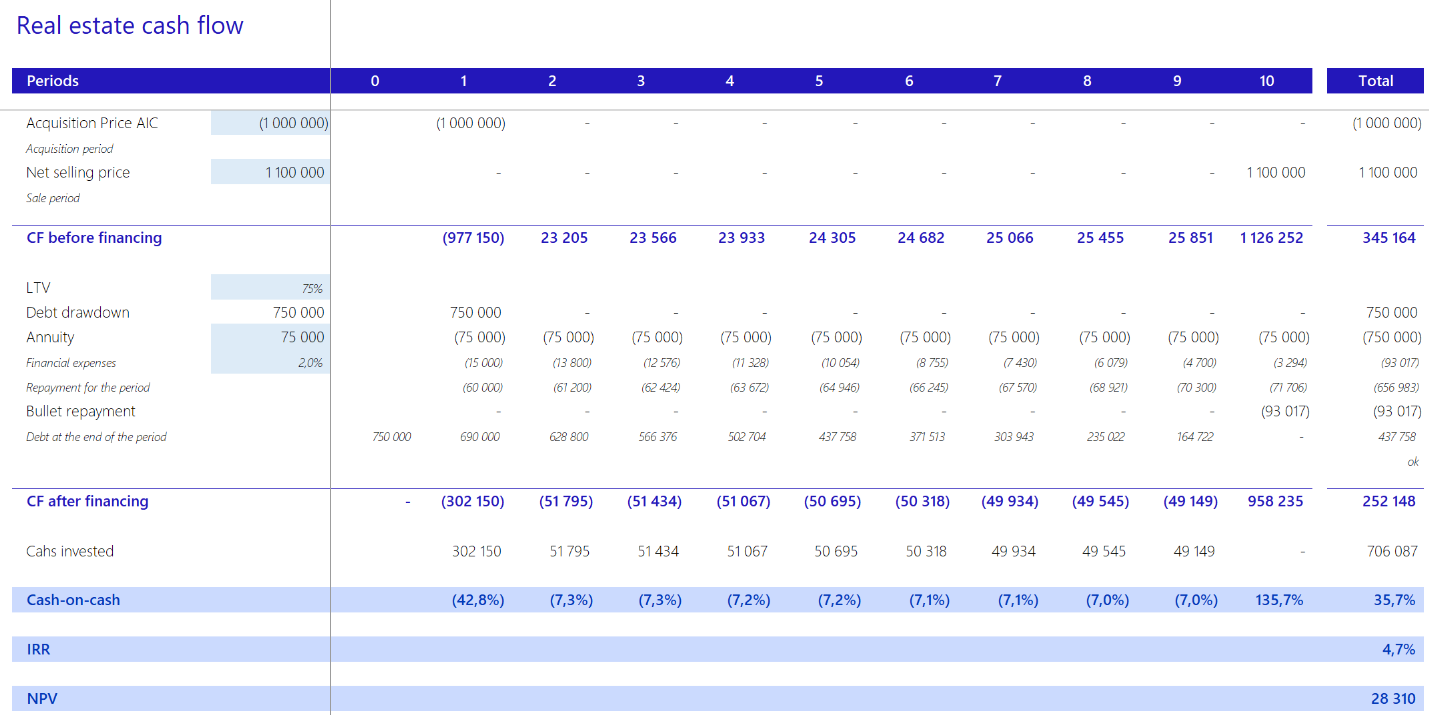
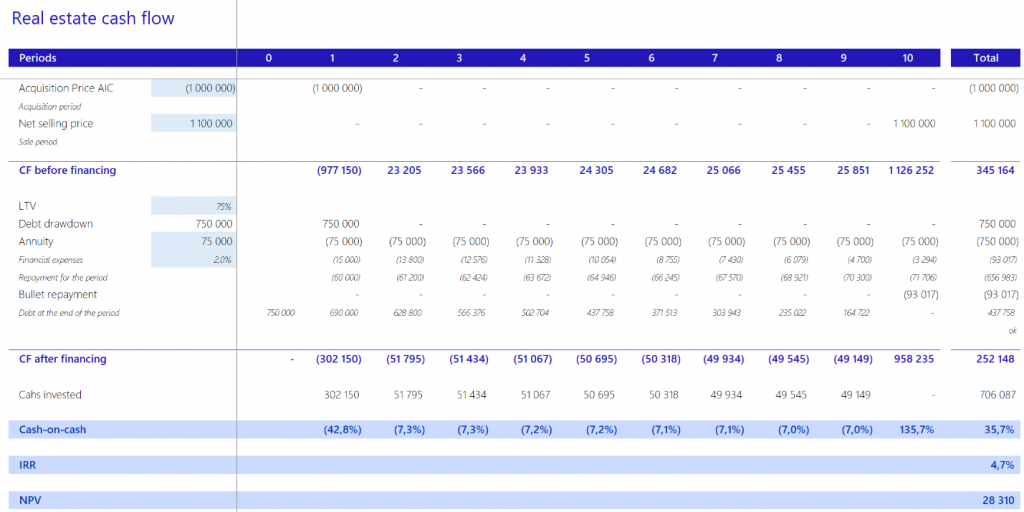
Here is a simplified Excel model to help you understand how to calculate cash-on-cash, IRR and NPV for a property project.