Tips for improving the design of a Power BI report
Are you about to create a Power BI dashboard but unsure where to begin? Have you already developed a Power BI report but feel dissatisfied with its visual appeal? Would you like to increase the adoption rate of your interactive Power BI report? Then this article is for you!
Report design goes beyond aesthetics. It also encompasses user experience, ergonomics, and the overall intuitiveness of the report. At F31, we believe design should be at the core of development to ensure user adoption. That’s why we’ve made it one of our key areas of expertise.
Based on our experience, here are 7 tips to enhance the design of your Power BI dashboards.
Respect your company’s graphic charter
If your company has a graphic charter, it typically includes the fonts to use, primary colour themes, and certain visual elements (such as icons, images, and photos).
There are two key benefits to adhering to this charter:
- Streamlining your work: You’ll have access to the essential tools needed to develop the foundation of your report. The charter serves as a useful framework to start your project, preventing you from getting lost in the search for a visual identity.
- Ensuring consistency: All company publications—whether internal presentations or official communications—need to maintain graphical consistency. By following the graphic charter, your report can be exported and shared directly without needing additional visual adjustments.
If you don’t have a graphic charter, identify the main colours used on your company’s website or logo. Numerous tools, such as Canva, can help you find complementary colours that work well together.
In Power BI, as in the entire Microsoft suite, you can:
- Save the active theme to edit it in JSON format or use it in another report (View tab > Themes > Save current theme).
- Load a pre-existing theme (View tab > Themes > Browse for themes).
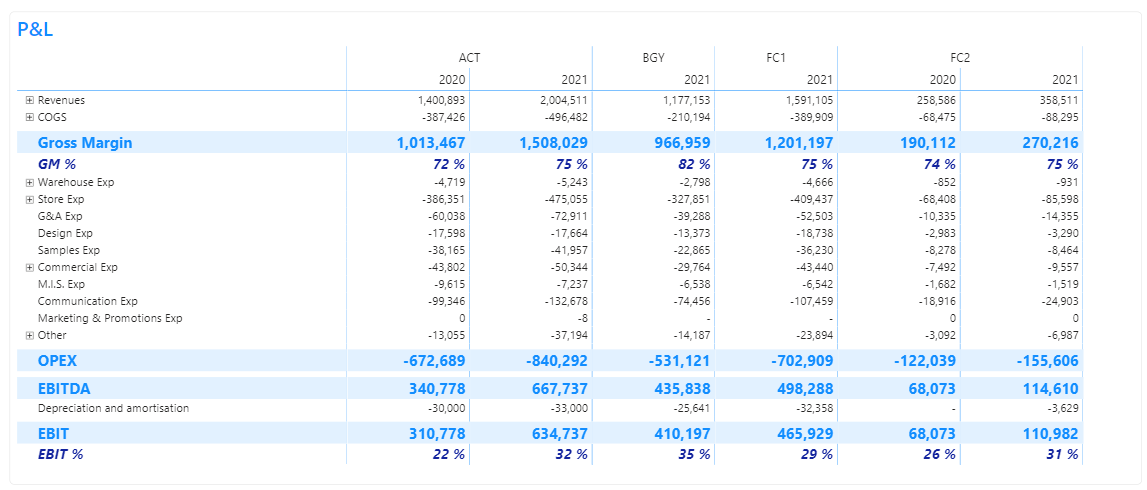
Developing simple, streamlined analyses
For successful report adoption, users must be able to fully understand and utilize all analyses on their own. However, some Power BI reports quickly become overwhelming due to:
- Too many visuals on a single page.
- Excessive information crammed into one visual.
- Analyses that either lack explanations or require overly complex descriptions to be understood.
To avoid the temptation of overloading or complicating your reports, we recommend starting with simple, clean report pages. Here are a few guidelines to follow:
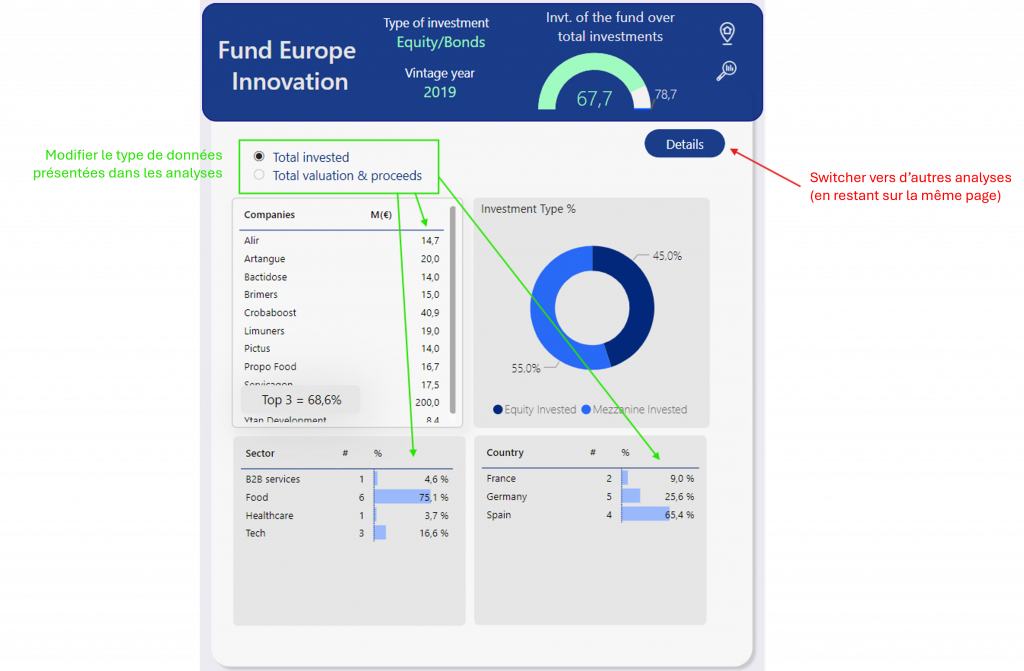
- Limit the number of visuals per page: It’s better to add an extra analysis page than to overcrowd an existing one. A helpful approach is to use field parameters. This feature lets you change the axis of analysis (row or column) or adjust the type of data being analysed through a slicer (i.e., a filter available on the page).
- Choose Appropriate Visuals : Select visuals that are relevant to the type of information you want to convey, whether it’s a comparison, breakdown, trend, or detailed analysis. The Power BI Visuals Reference guide by SQLBI is a great resource to help you make the right choice.
- Keep visuals simples and uncluttered. Some tips for streamlining your visuals include:
– Limiting the number of columns
– Simplifying or omitting the titles of vertical and horizontal axes, as well as the scales (if data labels are displayed, axis titles might be unnecessary))
– Avoiding redundancy, like showing both absolute changes and percentage changes for the same data point
– Removing unnecessary decimals
– Displaying amounts in units instead of thousands, where appropriate
Additional elements such as text, colours, and icons can be added later, but only to enhance clarity or provide further explanation, such as titles, legends, or to highlight a specific variation.
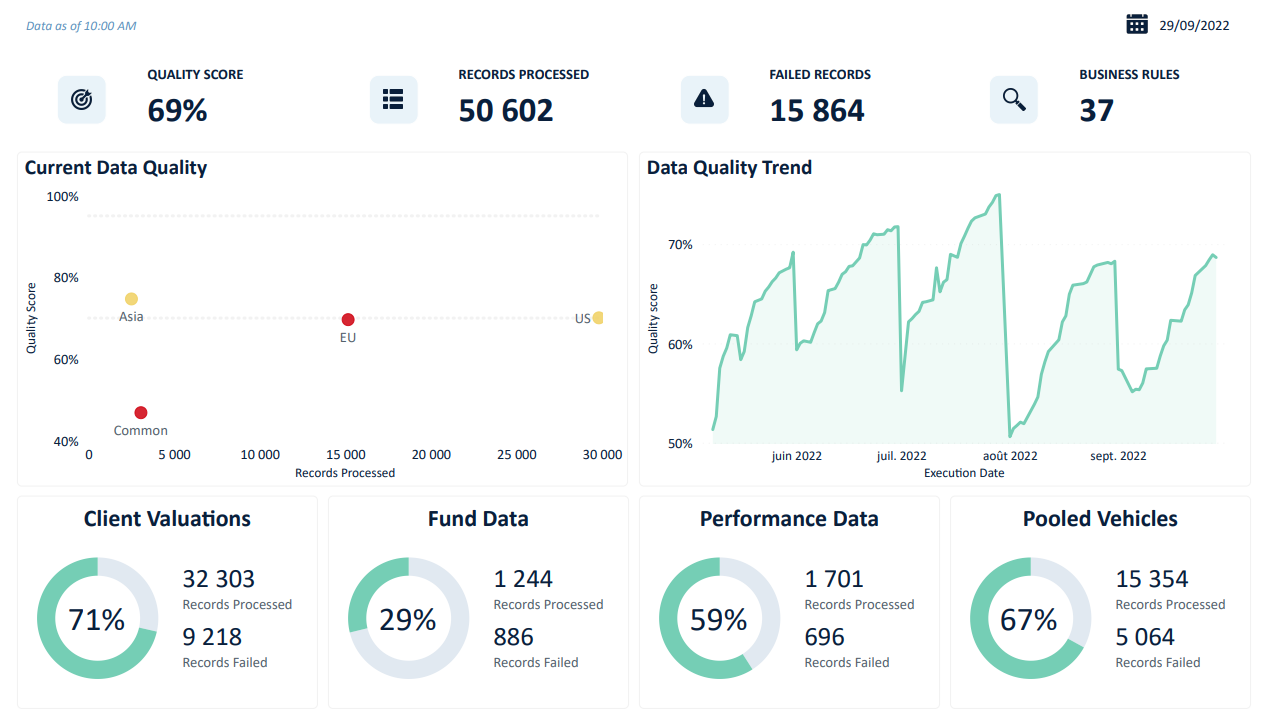
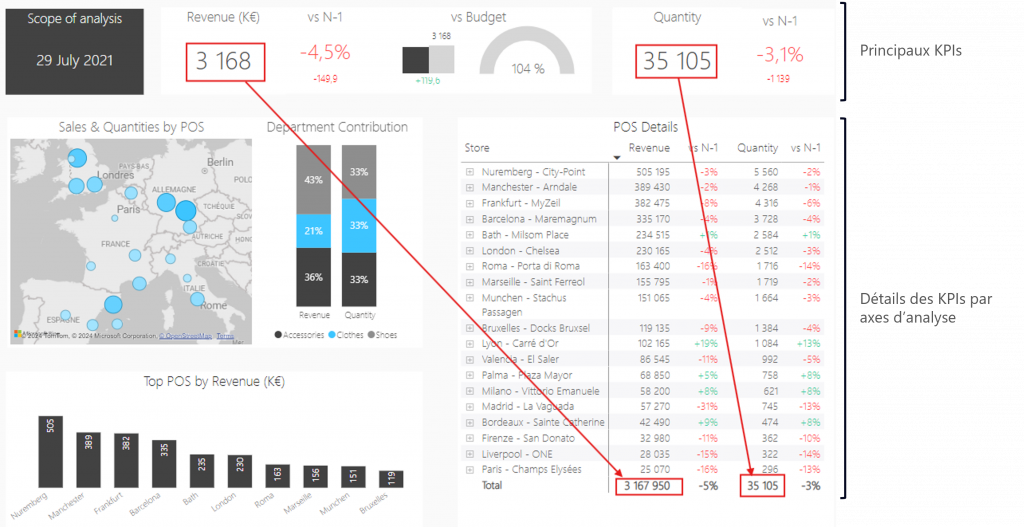
Adopt funnel logic
Funnel logic involves structuring your report as follows:
- At the top of the page: Present the global data, featuring the main KPIs.
- The rest of the page: Break down these same indicators according to different axes of analysis.
By starting with the main KPIs, users are provided with a clear reference for overall figures, helping them maintain a sense of scale as they explore the more detailed analyses presented below.
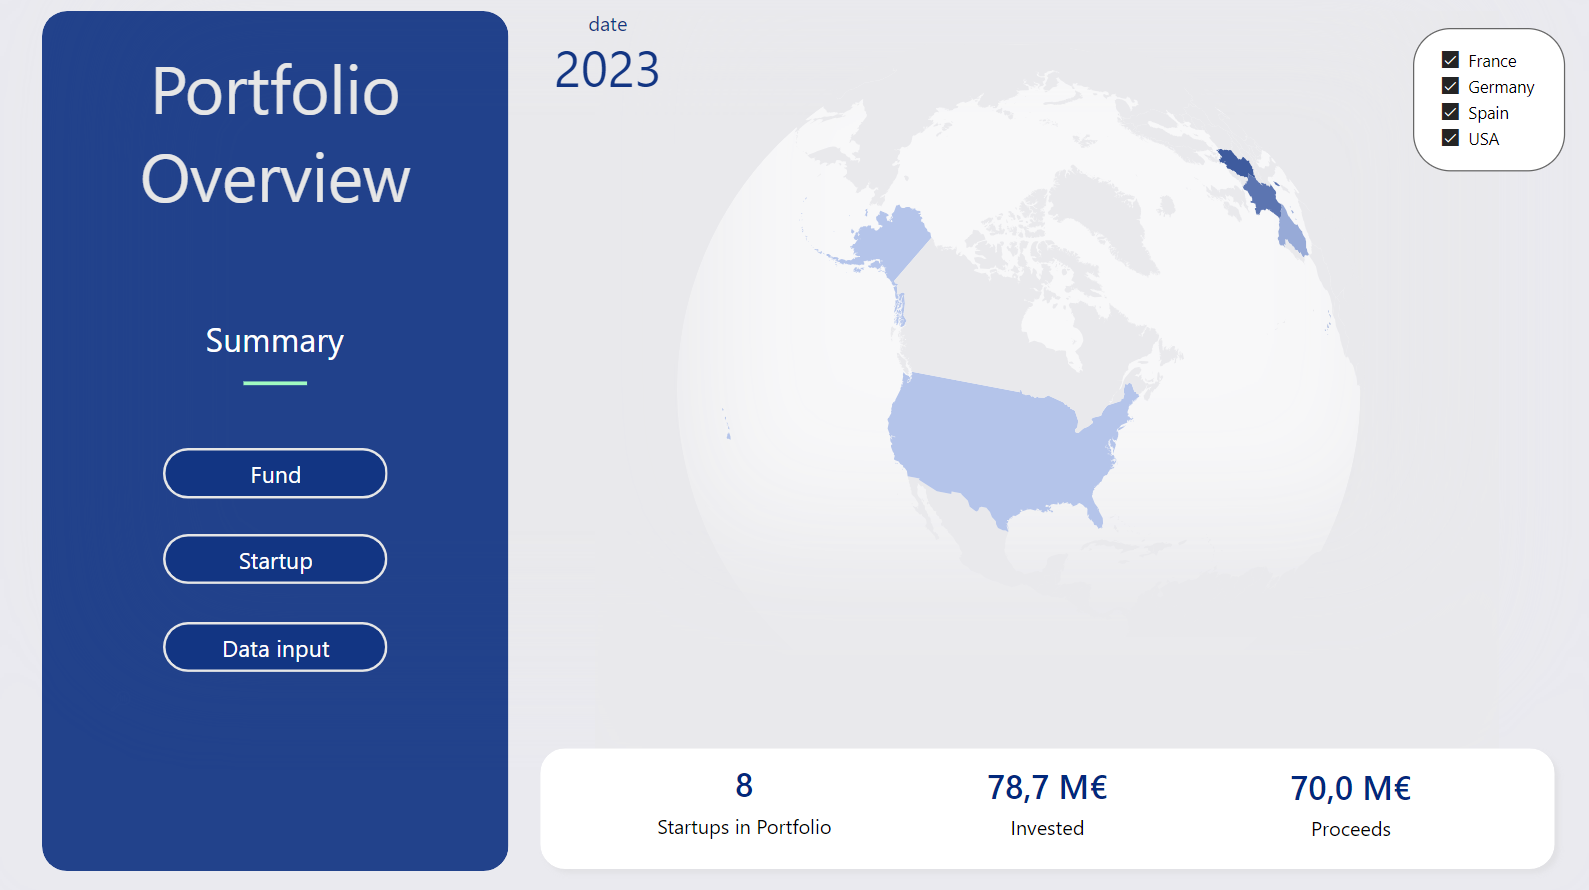
Funnel logic can also be applied to how your report pages are organized. Typically, the home page is followed by an Overview page, which presents the key indicators of the report (main metrics like revenue, expenses, headcount, etc.). The Overview page can also serve as a navigation hub, guiding users to the more detailed pages of the report.
User guidance
To guide the user’s eye through the report, a clear pathway must be designed:
- Home Page Design :
– Include the report title prominently
– Display the date of the last report update
– Feature the company logo, which can serve as a clickable element to return to the home page
– Provide an overview of available pages (page navigation or browser)
- Maintain an identical visual structure between pages, for example :
– Position the company logo consistently at the top of each page, with functionality to return to the home page
– Include a visual banner (either horizontal or vertical) on each page, featuring: the current page title for orientation, navigation buttons for easy access to other pages, indicators for segments or filters applied
- Align visual elements for improved readability in analyses, ensuring consistent use of colour, font, and font size across titles, subtitles, captions, and other elements.
Attention to detail
Focusing on the finer details of your report will elevate its professionalism. Below is a non-exhaustive list of simple, actionable checks to perform during development, particularly before publishing:
- Ensure the report opens on the home page (otherwise, users will land on the last page you visited).
- Keep the filter panel accessible only if users need to interact with it.
- Rename fields in the filter panel for clarity, making them intuitive (e.g. “📅 Select a month:”).
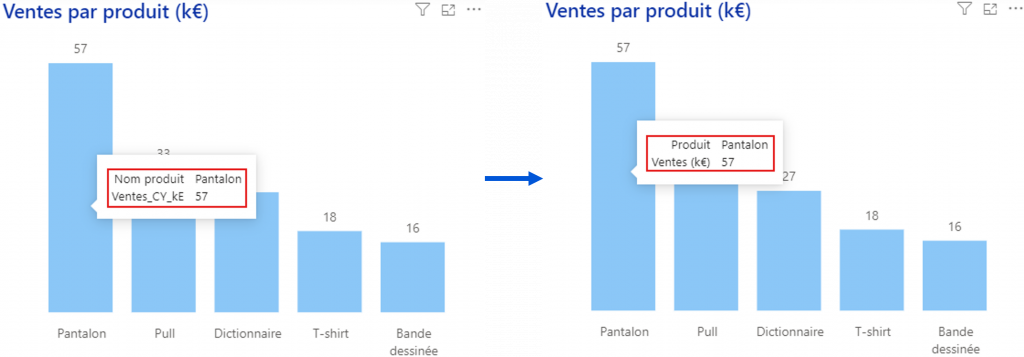
- Remove tooltips and visual headers from analyses where they aren’t necessary.
- Ensure measures displayed in tooltips have self-explanatory names.
- Remove tooltips from action buttons unless needed or customize their text to be more descriptive (e.g., “Click here to access the country details page” instead of the default “Click here to follow the link”).

- Ensure all navigation buttons direct users to the correct pages.
- Verify that bookmarks do not trigger the filter panel.
💡 Feel free to save and expand this checklist with any additional steps you perform when developing Power BI reports. Having this guide will help establish best practices early in the development process, saving you significant time in the long run!
Enhance the user experience
After applying all the above tips, consider asking a peer to review your report. Their feedback can provide valuable insights into any issues with the report’s intuitiveness or user-friendliness.
Find visual inspiration
To improve the design of your reports, explore these helpful resources:
- YouTube channels with Power BI development tips (e.g., How to Power BI, Goodly)
- Inspiration platforms like Pinterest and Dribble with keywords such as “dashboard,” “report,” “UX,” and “Power BI”
- Blogs by Power BI experts (e.g., sqlbi, Kerry Kolosko) and Power BI competition websites (e.g., Workout Wednesday)
Explore free mock-ups of complete reports on our website: Power BI Report – F31.